- Market Minute
- Posts
- Market Minute: S&P Futures Continue Cruising Higher
Market Minute: S&P Futures Continue Cruising Higher

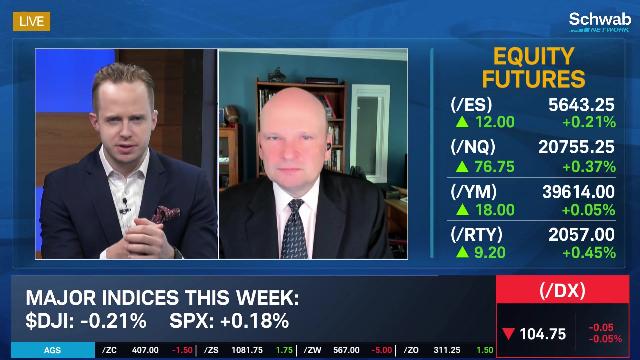
S&P 500 futures saw a strong green day yesterday, with the contract closing up about +0.93% and propelling traders into fresh all-time highs of 5,690.50. The move upward has been fairly steady ever since the 52-week lows of 4,122.25 in October and represents a roughly +38% climb as of yesterday’s close. Price has backed off slightly in early trading today, but markets are still a stone’s throw away from making new highs once again.
This bullish move may have confounded bearish traders looking for a pullback because the overall technical picture still looks relatively solid. A shorter-term upward trendline beginning with the lows on May 31 remains intact; meanwhile, price also remains above major moving averages, which continue to trend upward. Momentum is also giving a strongly bullish reading based on the Relative Strength Index (RSI). This indicator has been trending upward since a low point on Apr. 19, and is now once again in the overbought territory above 70. This is typically regarded as a sign of strength, and it’s also noteworthy that the RSI is making new relative highs above its previous peak along with price. Also, consider the Average Directional Index (ADX). This indicator gives a reading on trend strength, with the notable thresholds of 25 for a strong trend and 45 for a very strong trend. The ADX is currently at about 43.50 for the /ES, so by this measure the trend is strongly biased to the upside.
Looking for potential resistance when a financial product is making new all-time highs can be tricky, as traders have no prior price action to provide guidelines. One method of dealing with this issue is using the yearly Standard Deviation Channels study, which creates channels based on standard deviations to the upside and the downside from a Linear Regression Line. The +1 channel comes in near 5,876, so this could be one area for traders to watch going forward. To the downside, look for potential support near 5,545 based on the 21-day Exponential Moving Average as well as a volume node in the same general area. Beyond that, the highs from before the most recent contract change gap come in around 5,455.
Morning Minute
Featured Clips
Tune in live from 8 a.m. to 5 p.m. ET, or anytime, anywhere, on‑demand.
Or stream it via thinkorswim® and thinkorswim Mobile, available through our broker-dealer affiliate, Charles Schwab & Co., Inc
Please do not reply to this email. Replies are not delivered to Schwab Network. For inquiries or comments, please email [email protected].
See how your information is protected with our privacy statement.
Charles Schwab and all third parties mentioned are separate and unaffiliated, and are not responsible for one another's policies, services or opinions. Schwab Network is brought to you by Charles Schwab Media Productions Company (“CSMPC”). CSMPC is a wholly owned subsidiary of The Charles Schwab Corporation and is not a financial advisor, registered investment advisor, broker-dealer, or futures commission merchant.


