- Market Minute
- Posts
- Microsoft Headlines Massive Earnings Week
Microsoft Headlines Massive Earnings Week
Rick Ducat
July 26, 2025
Traders are gearing up for a huge earnings week in which the tech titan Microsoft (MSFT) is one of the headline names on Wednesday.
Meanwhile, this period also includes several other Magnificent 7 names like Meta Platforms (META), Apple (AAPL) and Amazon (AMZN) as well as of a host of other major companies. Notable sectors include Technology (QCOM, ARM, LRCX, MSTR), Financials (V, MA, C, COIN), Healthcare (ABBV, UNH, AZN, MRK), Energy (XOM, CVX), and Communication (T, SPOT, CMCSA, RBLX, EA, RDDT).
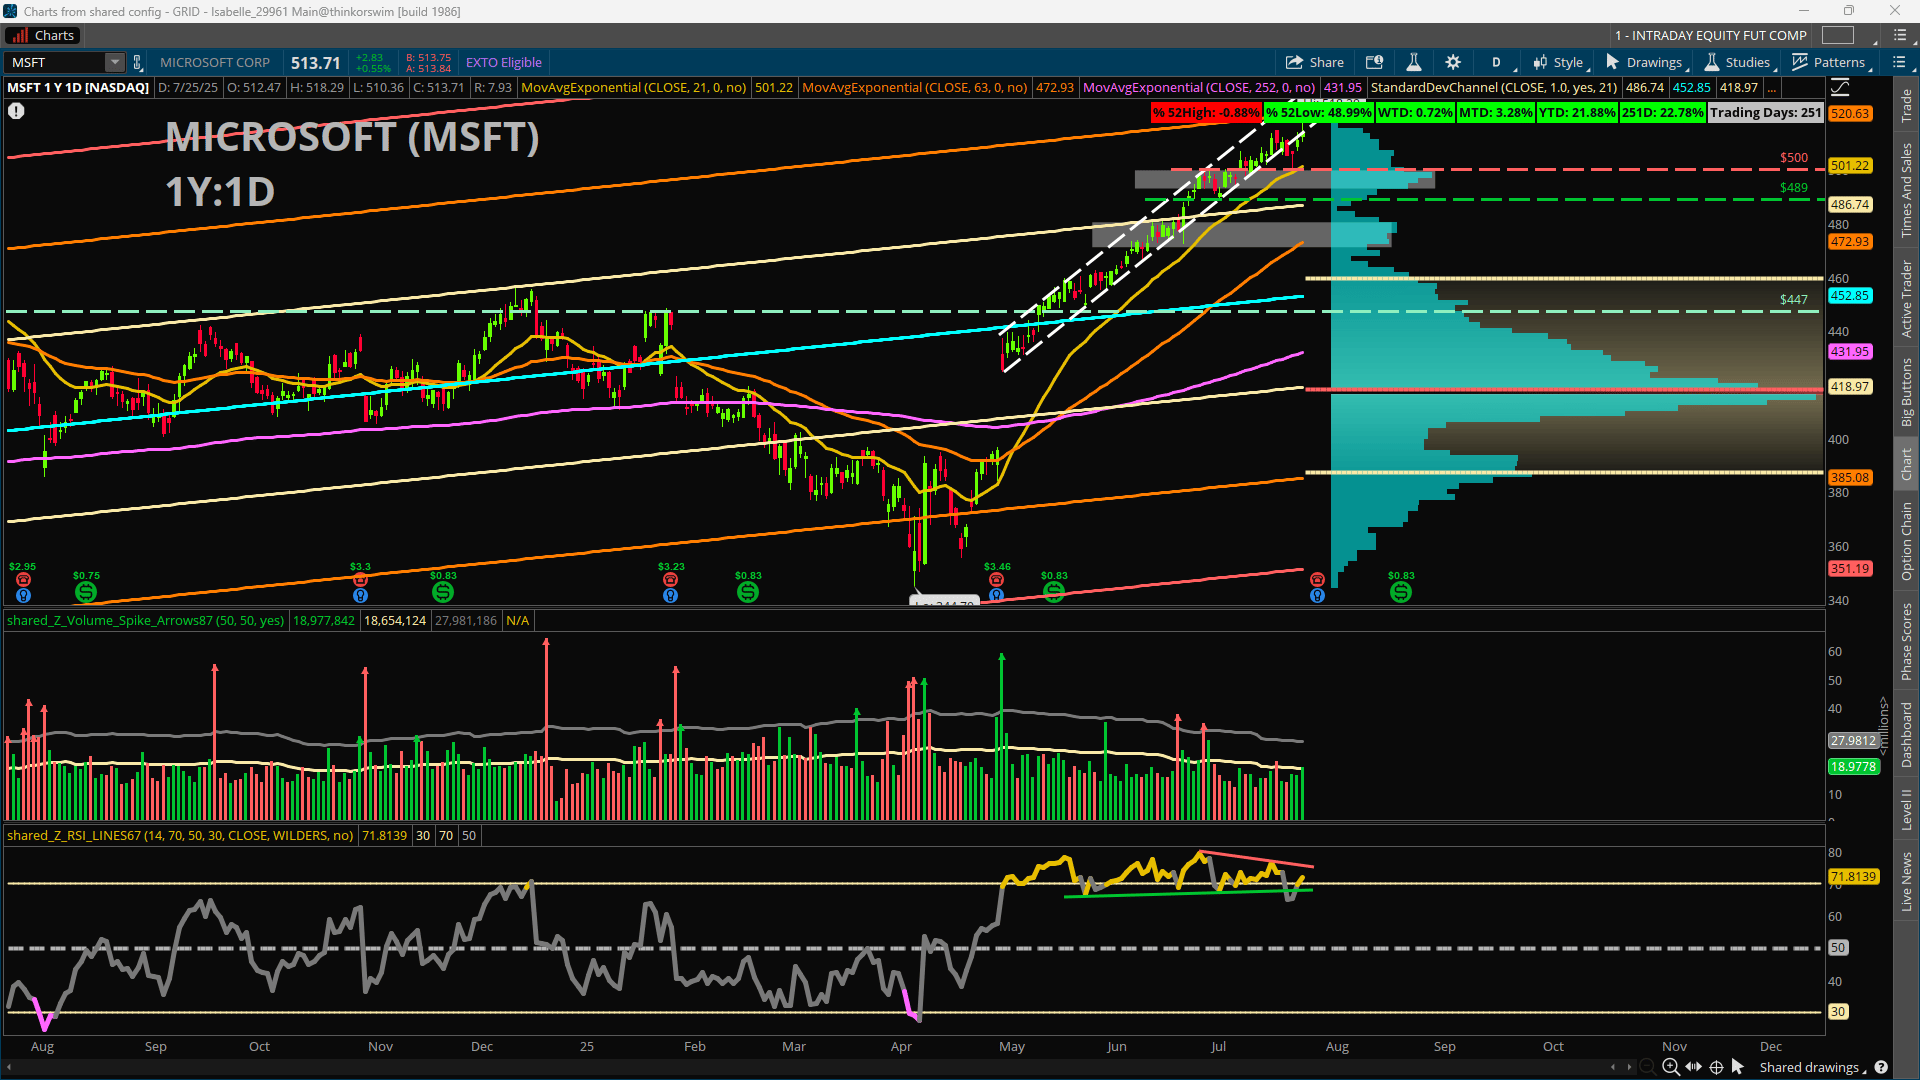
Microsoft, the world’s second most-valuable company with a $3.8T market cap, will post its results after the close on July 30. Analysts are looking for EPS of $3.35 vs. $2.95 one year ago (+13.5%), and for revenue to come in at $73.71B vs. $54.73B year-over-year (+13.8%), according to Zacks. Important business segments that traders will be looking at include cloud, devices, and personal computing. As for the options market, the potential expected move for the Aug. 1 expiration that will capture earnings is about +/-3.6%.
Tech has been one of the most closely watched sectors in the market, as the artificial intelligence race grows ever fiercer and the crucial semiconductor subsector continues to be roiled by trade and tariff headlines. A household name for decades since it came to dominate the personal computer market, Microsoft remains one of the top names in the field with its business spanning everything from software applications, cloud products, video games, social media, search engines, and more. Analysts largely seem to have positive expectations for MSFT. A recent survey of 38 analysts showed 12 as bullish and 26 as somewhat bullish, while Evercore ISI, Loop Capital, and UBS all raised their price targets for the company this week.
Microsoft shares remain near all-time highs, logging a fresh intraday peak of 518.29 on Friday. There are few technical signs that the trend is slowing even as earnings loom and activity can often lull. The Relative Strength Index (RSI) has shown several instances of bearish divergence in recent months but has also remained firmly in the overbought area for much of the same period giving traders a mismatch to consider.
Price remains above most major moving averages, which largely continue to diverge farther with faster ones outpacing slower ones. For potential upside resistance, the yearly +2 Standard Deviation Channel could be one area to watch just below 521. To the downside, one short-term area of interest is the 500-mark based on some old highs, the 21-day Exponential Moving Average, and a volume node coinciding near that area. Beyond that, the next volume node is roughly in line with the 63-day EMA near about 473.
Featured Clip

Tune in live from 8 a.m. to 5 p.m. ET, or anytime, anywhere, on‑demand.
Or stream it via thinkorswim® and thinkorswim Mobile, available through our broker-dealer affiliate, Charles Schwab & Co., Inc
Please do not reply to this email. Replies are not delivered to Schwab Network. For inquiries or comments, please email [email protected].
See how your information is protected with our privacy statement.
Charles Schwab and all third parties mentioned are separate and unaffiliated, and are not responsible for one another's policies, services or opinions. Schwab Network is brought to you by Charles Schwab Media Productions Company (“CSMPC”). CSMPC is a wholly owned subsidiary of The Charles Schwab Corporation and is not a financial advisor, registered investment advisor, broker-dealer, or futures commission merchant.