- Market Minute
- Posts
- Technical Damage Continues, So What’s Next?
Technical Damage Continues, So What’s Next?
Kevin Green
March 30, 2026

The big question: where is the next level of support for the market?
With the Iran escalation impacting global energy and shipping markets, private credit concerns still playing out in the background, and semiconductors potentially beginning to show signs of fracturing, it is worth taking a closer look at market structure to gain insight into where we are in the current cycle and the key items to watch in the coming week.
From a technical standpoint, the S&P 500 is nearing correction territory, as the index has pulled back more than 9%. The SPX is now trading below its 200-day simple moving average, and over the next week we may also see a bearish cross, with the 20-day SMA moving below the 200-day SMA.
That said, the weekly chart provides a better perspective on the key levels of focus over the coming weeks.
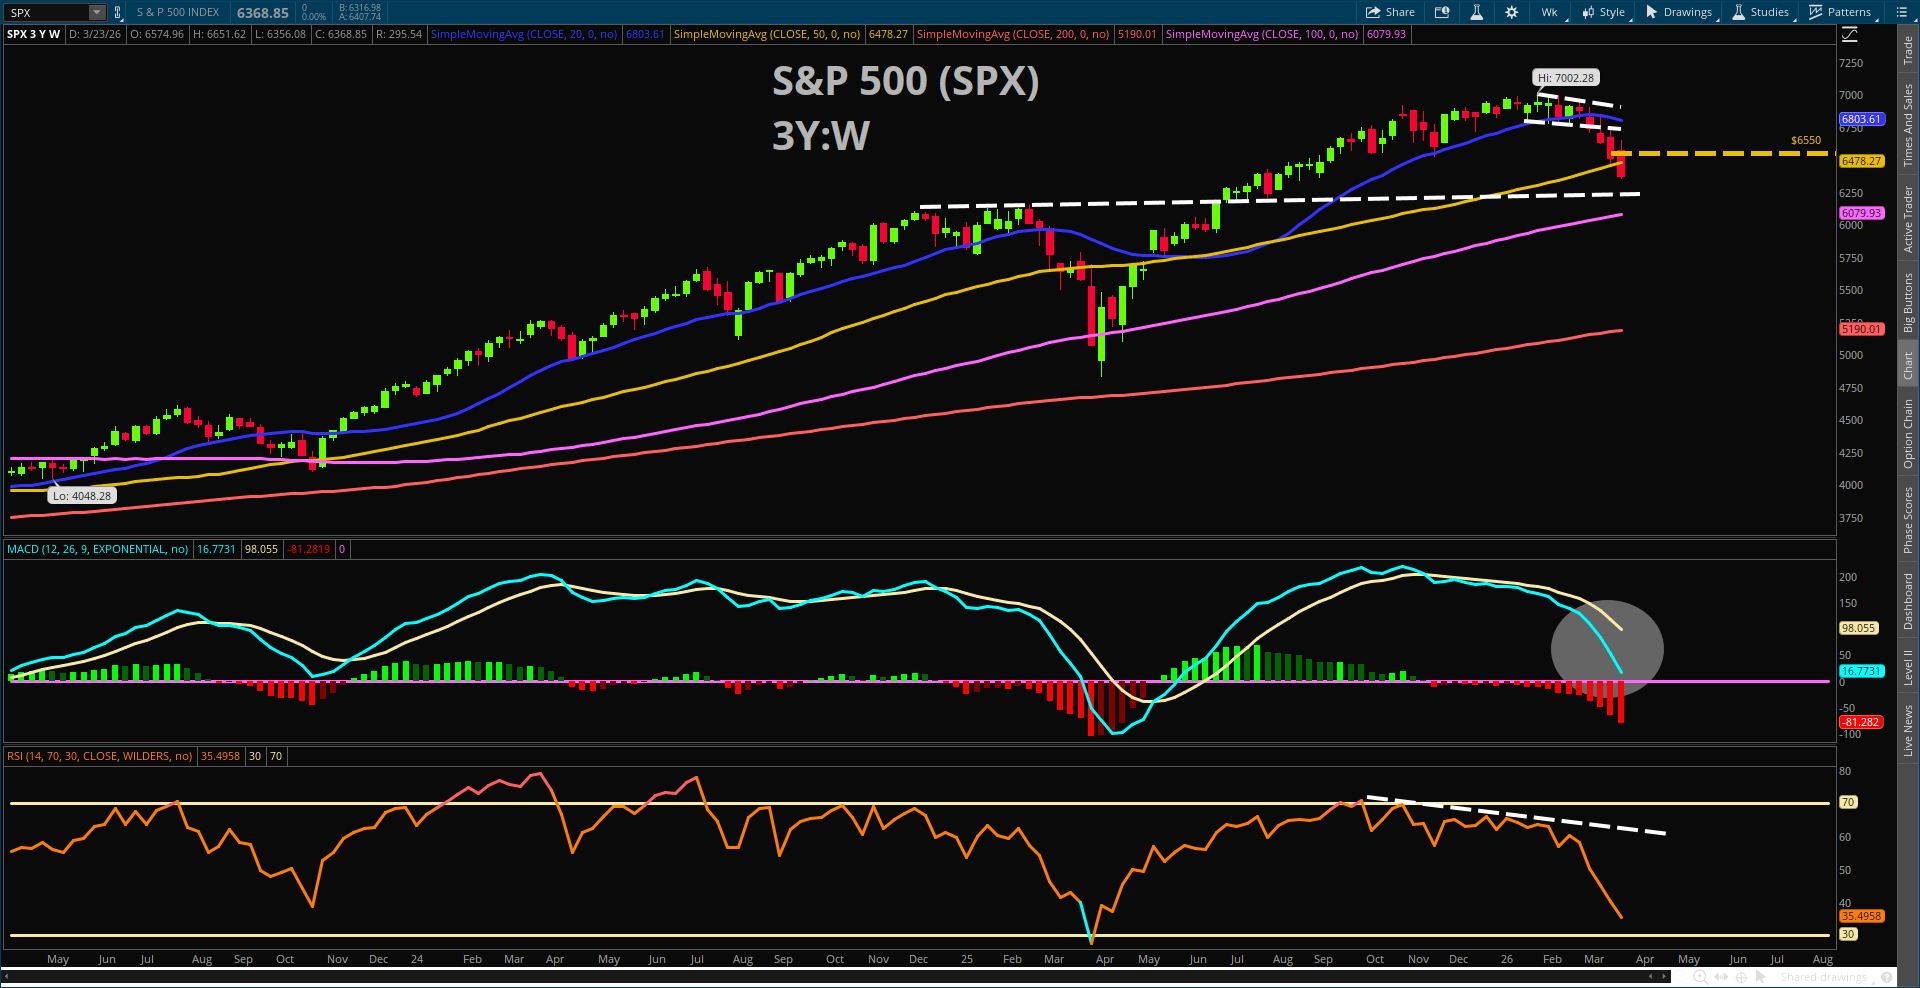
After losing the 50-week SMA, the S&P 500 could consolidate and retest that moving average throughout the week. Historically, the 50-week moving average is not always the strongest support level for the index, but it often serves as a consolidation zone in the event this cycle still has more room to the downside.
The 100-week SMA is the next major area of support, and it is where buyers could potentially step in for several reasons. First, this moving average is near the 6,000 level (approximately 6,079.93 this morning). Second, the 6,000 zone acted as a major area of resistance from late 2024 into early 2025, before the tariff-driven selloff. A previous area of resistance may now flip into a meaningful area of support. Third, options positioning throughout the latter half of 2024 and early 2025 heavily centered around the 6,000 strike, which may also help explain some of the index resistance seen in early 2025.
The market still appears to be firmly in risk-off mode, and even if this week results in a positive bounce, it is important to remember that the 50-week SMA traditionally acts as a consolidation zone that could precede a potential further flush lower.
The next question is: what could drive the market lower even after the geopolitical risk events and idiosyncratic private credit concerns.
At the moment, the only other industry that carries significant weight in the broader market and is flashing signals of a meaningful pullback on the horizon is the semiconductor space.
Nvidia at a Critical Inflection Point
Nvidia (NVDA) is now at a critical make-or-break technical level after breaking below the $170 level last week and closing near the lows. The stock has been consolidating between $170 and $200 since July of last year.
Some may argue that this is simply a consolidation in time before moving higher, and that may still prove to be the case. However, there is no denying that key technical indicators are currently reflecting more of a rollover pattern.
The stock closed below the 50-week SMA, while the RSI continues to make lower highs and lower lows, signaling that price momentum is changing direction.
In addition, the weekly MACD is now approaching the zero line, after the 12-week EMA firmly crossed below the 26-week EMA. The next critical area of support for NVDA is around the $145 level.
This target is derived by taking the average width of the consolidation range—approximately $25 to $28—and subtracting that from the $170 support floor, which brings the stock to roughly $145. Importantly, this also roughly aligns with the 100-week moving average, which acted as a key pivot point back in April of last year.

Semiconductor Breadth Also Weakening
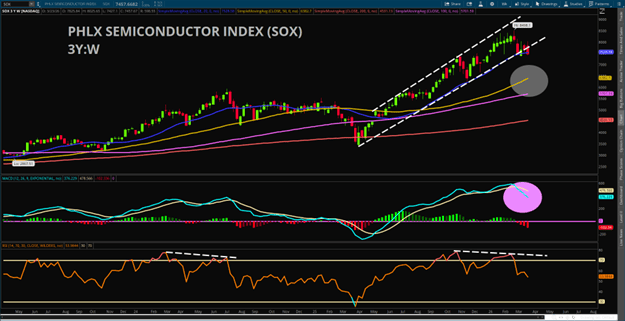
The weekly chart of the PHLX Semiconductor Sector Index (SOX) also reflects this broader weakness within the industry. The primary bullish channel officially broke last week.
The index also closed below the 20-week SMA, while the MACD generated an initial bearish crossover, with the 12-week average crossing below the 26-week average.
At the same time, the RSI continues to make lower highs and is developing a bearish divergence, which may begin to fully materialize over the coming weeks.
Overall, the technicals still lean more bearish than bullish at the moment. Liquidity remains anemic, which contributes to elevated volatility levels, while multiple market factors are working themselves out simultaneously. In the short term, the market still looks weak, but several key sectors are now approaching oversold conditions, both technically and from a valuation standpoint. Stay nimble.
Morning Minute
Featured Clip

Tune in live from 8 a.m. to 5 p.m. ET, or anytime, anywhere, on‑demand.
Or stream it via thinkorswim® and thinkorswim Mobile, available through our broker-dealer affiliate, Charles Schwab & Co., Inc
Please do not reply to this email. Replies are not delivered to Schwab Network. For inquiries or comments, please email [email protected].
See how your information is protected with our privacy statement.
This material is intended for informational purposes only and should not be considered a personalized recommendation or investment advice. Investors should review investment strategies for their own particular situations before making any decisions.
Schwab Network is brought to you by Charles Schwab Media Productions Company (“CSMPC”). CSMPC is a subsidiary of The Charles Schwab Corporation and is not a financial advisor, registered investment advisor, broker-dealer, or futures commission merchant.
Charles Schwab Media Productions Company and all third parties mentioned are separate and unaffiliated, and are not responsible for one another's policies, services or opinions.
Data contained herein is obtained from what are considered reliable sources. However, its accuracy, completeness, or reliability cannot be guaranteed. All events and times listed are subject to change without notice.